Stock Market Simulator main e8c3612
A game that provides a realistic stock buying experience with unpredictable trends to test investment strategies.
Loading...
Searching...
No Matches
graph.cpp File Reference

Graph plotting functions. More...

#include "graph.h"
#include "file_io.h"
#include "format.h"
#include <algorithm>
#include <cassert>
#include <fstream>
#include <iomanip>
#include <iostream>
#include <sstream>
Include dependency graph for graph.cpp:

Go to the source code of this file.

Functions

void graph_plotting (const string &player, int stocknum, int width, int height)
 Plot the graph of the stock price history to std::cout.
 
vector< float > graphinput (const string &player, int stocknum, string &stockname, unsigned int width)
 
string graphpriceformat (float price)
 
void printgraphblocks (const vector< vector< string > > &screenElements, const vector< string > &specifiedColorCoordinates, const int width, const int height)
 
void printstocknameandoverall (const string &stockname, vector< float > stockpricehistory, int stocknum)
 

Detailed Description

Graph plotting functions.

Definition in file graph.cpp.

Function Documentation

◆ graph_plotting()

void graph_plotting ( const std::string & player,
int stocknum,
int width,
int height )

Plot the graph of the stock price history to std::cout.

Parameters
playerthe name of the player
stocknumthe stock number of the stock, -1 for HSI
widththe width of the graph
heightthe height of the graph

Definition at line 135 of file graph.cpp.

135 {
136 float highest_price;
137 float lowest_price;
138 string stockname;
139 vector<float> stockpricehistory = graphinput(player, stocknum, stockname, width);
140 // convert the raw log input into the nearest "width" data points
141 vector<string> color(width - 9, textWhite);
142 color[width - 10] = textWhite;
143 if (stockpricehistory.size() <= 1) {
144 cout << "Why do you want to plot graph if there is only one data point?"
145 << endl;
146 return;
147 }
148 highest_price = *max_element(stockpricehistory.begin(), stockpricehistory.end());
149 lowest_price = *min_element(stockpricehistory.begin(), stockpricehistory.end());
150 float interval = (highest_price - lowest_price) / height;
151 vector<vector<string>> graph(width, vector<string>(height, " "));
152 // height column width rows, this is not in the usual 2d array format
153 // horizontal array and vertical array is inverted
154 string maxstring;
155 string minstring;
156 if (interval == 0) {
157 maxstring = graphpriceformat(highest_price + 1);
158 minstring = graphpriceformat(lowest_price - 1);
159 }
160 else {
161 maxstring = graphpriceformat(highest_price);
162 minstring = graphpriceformat(lowest_price);
163 }
164
165 for (int i = 0; i < 6; i++) {
166 graph[i][0] = maxstring[i];
167 graph[i][height - 1] = minstring[i];
168 }
169 // \DeclareUnicodeCharacter{2517}{\L}
170
171 for (unsigned int i = 0; i < stockpricehistory.size() - 1; i++) {
172 int start = 10;
173 int end = 10;
174 if (interval != 0) {
175 start = (height - 1) - (stockpricehistory[i] - lowest_price) / interval;
176 end = (height - 1) - (stockpricehistory[i + 1] - lowest_price) / interval;
177 // Checks to prevent out of bounds (SEGFAULT)
178 if (start < 0) {
179 start = 0;
180 }
181 if (end < 0) {
182 end = 0;
183 }
184 if (start >= height) {
185 start = height - 1;
186 }
187 if (end >= height) {
188 end = height - 1;
189 }
190 }
191 if (start == end) {
192 graph[i + 9][start] = "■";
193 if (stockpricehistory[i] > stockpricehistory[i + 1]) {
194 color[i] = textGreen;
195 }
196 else if (stockpricehistory[i] < stockpricehistory[i + 1]) {
197 color[i] = textRed;
198 }
199 }
200 if (start > end) {
201 for (int j = end; j <= start; j++) {
202 graph[i + 9][j] = "■";
203 }
204 color[i] = textGreen;
205 }
206 else if (start < end) {
207 for (int j = start; j <= end; j++) {
208 graph[i + 9][j] = "■";
209 }
210 color[i] = textRed;
211 }
212 // idk why the colour is inverted using the normal setup method but i dont care
213 // anyway it is running in normal HK stock colour indentations
214 }
215 for (int i = 0; i < height; i++) {
216 graph[8][i] = "┃";
217 }
218 for (int i = 9; i < width; i++) {
219 graph[i][height - 1] = "━";
220 }
221 graph[8][height - 1] = "┗";
222 printstocknameandoverall(stockname, stockpricehistory, stocknum);
223 printgraphblocks(graph, color, width, height);
224}
const string textGreen
Definition format.cpp:31
const string textWhite
Definition format.cpp:36
const string textRed
Definition format.cpp:30
void printstocknameandoverall(const string &stockname, vector< float > stockpricehistory, int stocknum)
Definition graph.cpp:50
string graphpriceformat(float price)
Definition graph.cpp:30
vector< float > graphinput(const string &player, int stocknum, string &stockname, unsigned int width)
Definition graph.cpp:98
void printgraphblocks(const vector< vector< string > > &screenElements, const vector< string > &specifiedColorCoordinates, const int width, const int height)
Definition graph.cpp:67

References graphinput(), graphpriceformat(), printgraphblocks(), printstocknameandoverall(), textGreen, textRed, and textWhite.

Referenced by main().
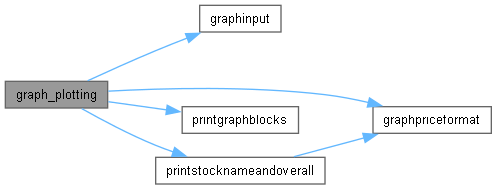
Here is the call graph for this function:
Here is the caller graph for this function:

◆ graphinput()

vector< float > graphinput ( const string & player,
int stocknum,
string & stockname,
unsigned int width )

Definition at line 98 of file graph.cpp.

99 {
100 string filename;
101 if (stocknum != -1) {
102 filename = SAVE_FOLDER_PREFIX + player + "/" + to_string(stocknum) + "" +
104 }
105 else {
106 filename = SAVE_FOLDER_PREFIX + player + "/hsi" + SAVE_FILE_EXTENSION_TXT;
107 }
108 ifstream fin;
109 float x;
110 vector<float> stockpricehistory;
111 fin.open(filename.c_str());
112 if (stocknum != -1) {
113 fin.ignore(256, '\n');
114 getline(fin, stockname);
115 fin >> x;
116 while (x != -1) {
117 stockpricehistory.emplace_back(x);
118 fin >> x;
119 }
120 }
121 else {
122 float loadedPrice;
123 while (fin >> loadedPrice) {
124 stockpricehistory.emplace_back(loadedPrice);
125 }
126 }
127 if (stockpricehistory.size() > (width - 9)) { // limit graph size to width
128 stockpricehistory.erase(
129 stockpricehistory.begin(), stockpricehistory.end() - (width - 9));
130 }
131 stockpricehistory.shrink_to_fit();
132 return stockpricehistory;
133}
const std::string SAVE_FOLDER_PREFIX
Definition file_io.h:45
const std::string SAVE_FILE_EXTENSION_TXT
Definition file_io.h:48

References SAVE_FILE_EXTENSION_TXT, and SAVE_FOLDER_PREFIX.

Referenced by graph_plotting().

Here is the caller graph for this function:

◆ graphpriceformat()

string graphpriceformat ( float price)

Definition at line 30 of file graph.cpp.

30 {
31 // lock the max/min value between 6 chars
32 stringstream ss;
33 unsigned int exponent;
34 ss << fixed << setprecision(2) << price;
35 string pricestring = ss.str();
36 if (price >= 100000) {
37 exponent = pricestring.length() - 3;
38 pricestring = string(1, pricestring[0]) + "." + string(1, pricestring[1]) + "e";
39 if (exponent < 10) {
40 pricestring += "0";
41 }
42 pricestring += to_string(exponent);
43 } // change the max/min value to scientific notation if needed
44 while (pricestring.size() < 6) {
45 pricestring = " " + pricestring;
46 }
47 return pricestring;
48}

Referenced by graph_plotting(), and printstocknameandoverall().

Here is the caller graph for this function:

◆ printgraphblocks()

void printgraphblocks ( const vector< vector< string > > & screenElements,
const vector< string > & specifiedColorCoordinates,
const int width,
const int height )

Definition at line 67 of file graph.cpp.

69 {
70 // Boundary check of width and height, otherwise may access screenElements out of
71 // bounds
72 assert(width <= static_cast<int>(screenElements.size()) &&
73 "Width exceeds screenElements width");
74 assert(height <= static_cast<int>(screenElements[0].size()) &&
75 "Height exceeds screenElements height");
76 int colorIndex;
77 for (int heightIndex = 0; heightIndex < height; heightIndex++) {
78 for (int widthIndex = 0; widthIndex < width; widthIndex++) {
79 colorIndex = widthIndex - 9;
80 if (colorIndex < 0) {
81 colorIndex = width - 10;
82 }
83 string colorCode = textDefault;
84 if (specifiedColorCoordinates[colorIndex] == textGreen) {
85 colorCode = textGreen;
86 }
87 else if (specifiedColorCoordinates[colorIndex] == textRed) {
88 colorCode = textRed;
89 }
90 cout << colorCode << screenElements[widthIndex][heightIndex] << textDefault;
91 }
92 cout << endl;
93 }
94}
const string textDefault
Definition format.cpp:28

References textDefault, textGreen, and textRed.

Referenced by graph_plotting().

Here is the caller graph for this function:

◆ printstocknameandoverall()

void printstocknameandoverall ( const string & stockname,
vector< float > stockpricehistory,
int stocknum )

Definition at line 50 of file graph.cpp.

51 {
52 string stocknameprint;
53 if (stocknum != -1) {
54 stocknameprint = "Stock: " + stockname;
55 }
56 else {
57 stocknameprint = "HSI:";
58 }
59 float overall =
60 (stockpricehistory[stockpricehistory.size() - 1] - stockpricehistory[0]) /
61 stockpricehistory[0] * 100;
62 cout << stocknameprint << R"( % change: )";
63 cout << graphpriceformat(overall) << "%" << endl;
64 cout << endl;
65}

References graphpriceformat().

Referenced by graph_plotting().

Here is the call graph for this function:
Here is the caller graph for this function: